
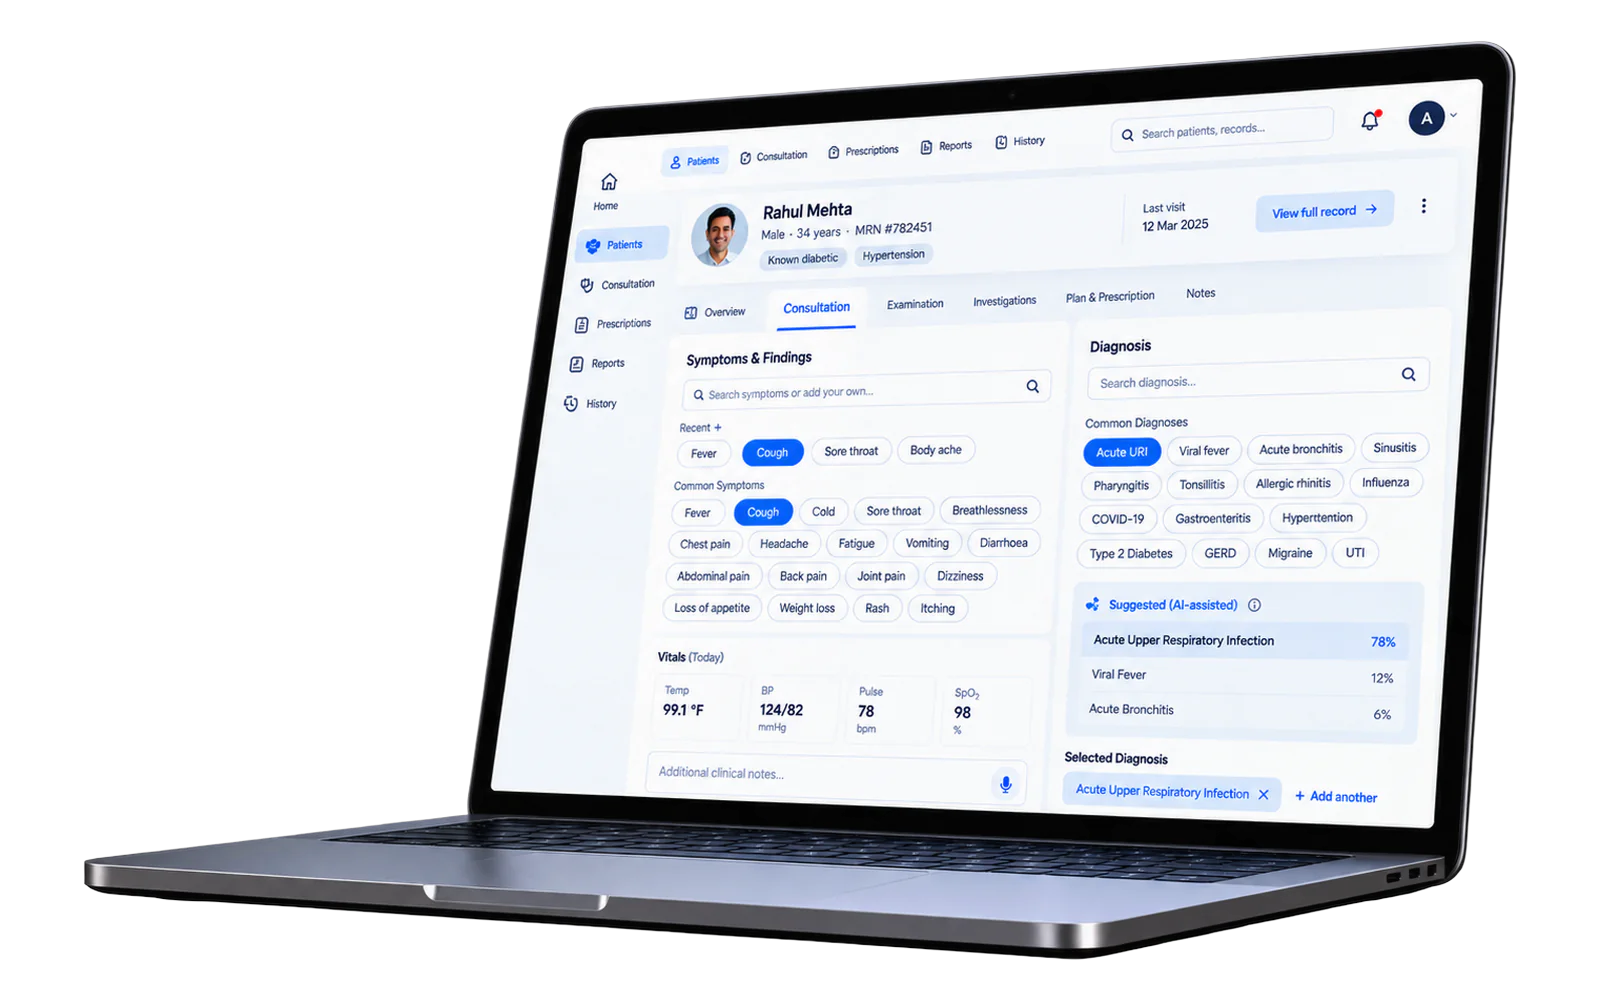
Who, why, and what
An Electronic Medical Record is the digital version of a patient's paper chart — history, diagnoses, medications, immunisation dates, allergies, test results and treatment plans in one record. The promise is better care quality, better coordination between providers, and data a doctor can actually reach.
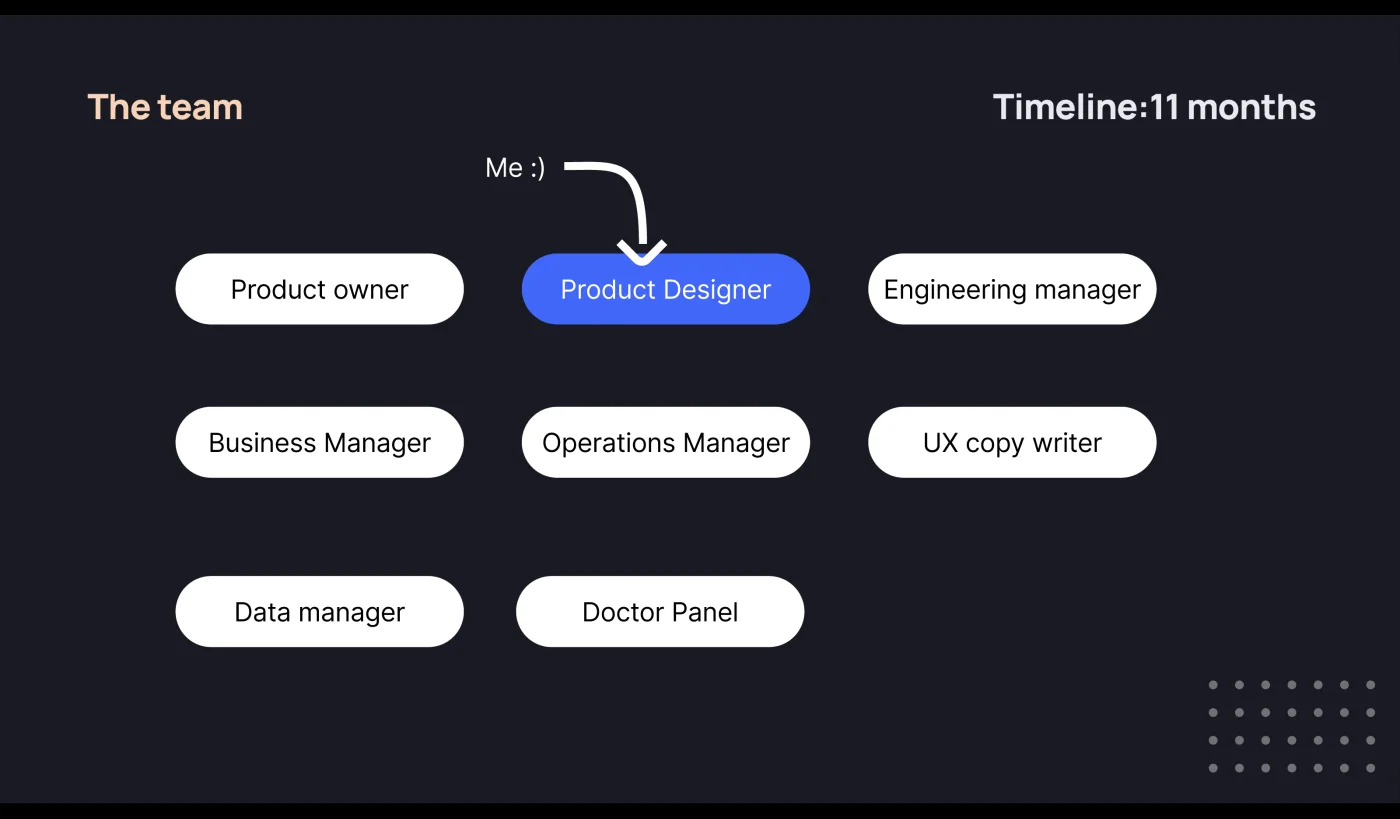
I joined as the product designer on an eleven-month build, working with a product owner, an engineering manager, business and operations managers, a data manager, a UX copywriter, and a standing panel of doctors.
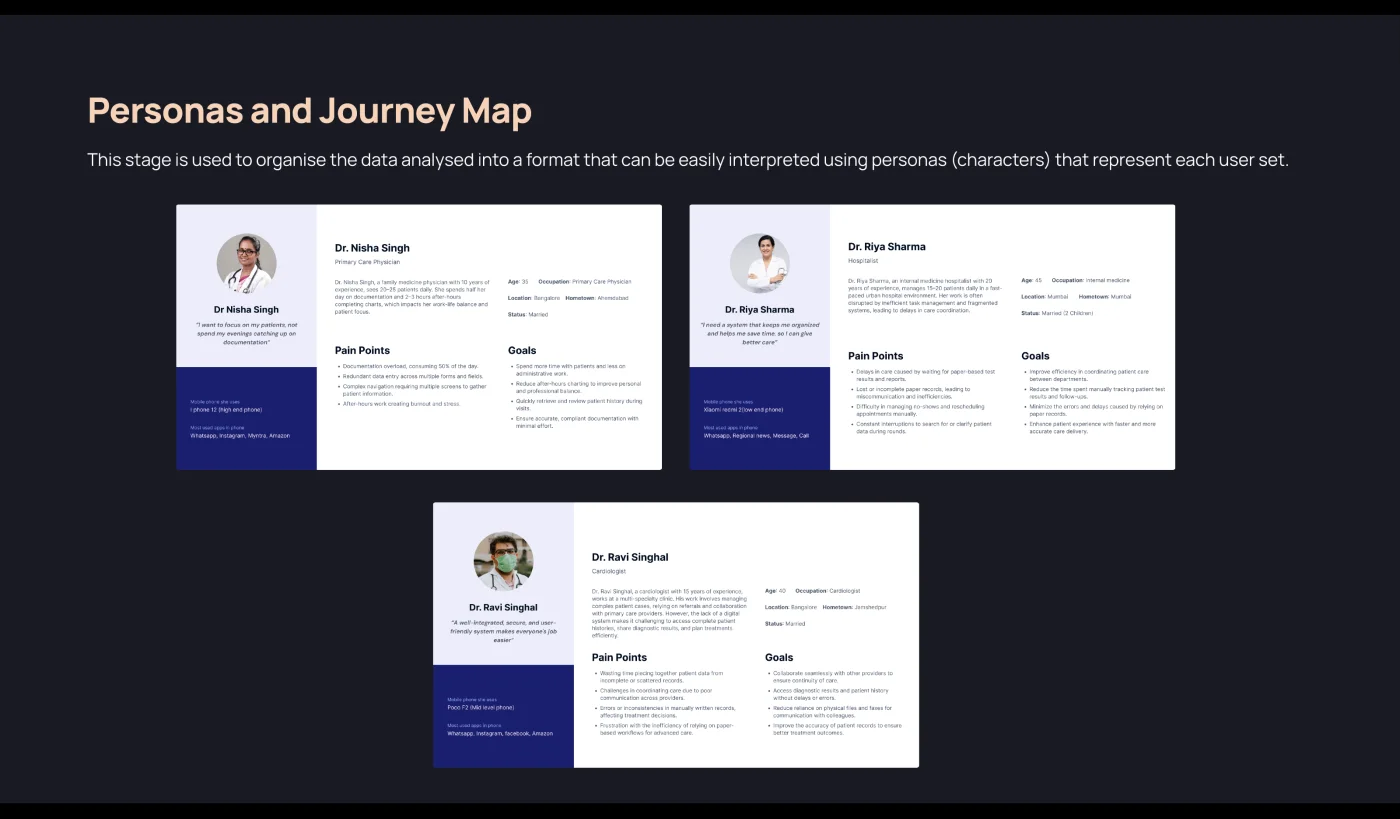
The doctor panel mattered more than the org chart suggests. Every speciality turned out to have requirements outside the regular treatment flow, and without that panel we would have designed for an average doctor who does not exist.
The business problem
Healthcare providers were running on outdated paper records and fragmented digital tools. The cost showed up in five places at once.
- Increased administrative burden
- Higher risk of medical errors
- Inefficient care coordination
- Poor patient data accessibility
- Compliance challenges with healthcare regulations
The brief
Conduct research, develop a strategy, and design a solution that enables doctors to maintain accurate patient records, streamline follow-ups, and ensure regulatory compliance across all platforms — desktop, laptop, tablet and mobile — so doctors can focus on delivering high-quality patient care.
How I researched it
Two intensive weeks, three methods, deliberately overlapping — because what doctors say about their workflow and what they do in the room are not the same thing.
The interviews told me what doctors believed about their day. The clinic observation told me what actually happened in it. The gap between those two is where this product came from.
Who I studied
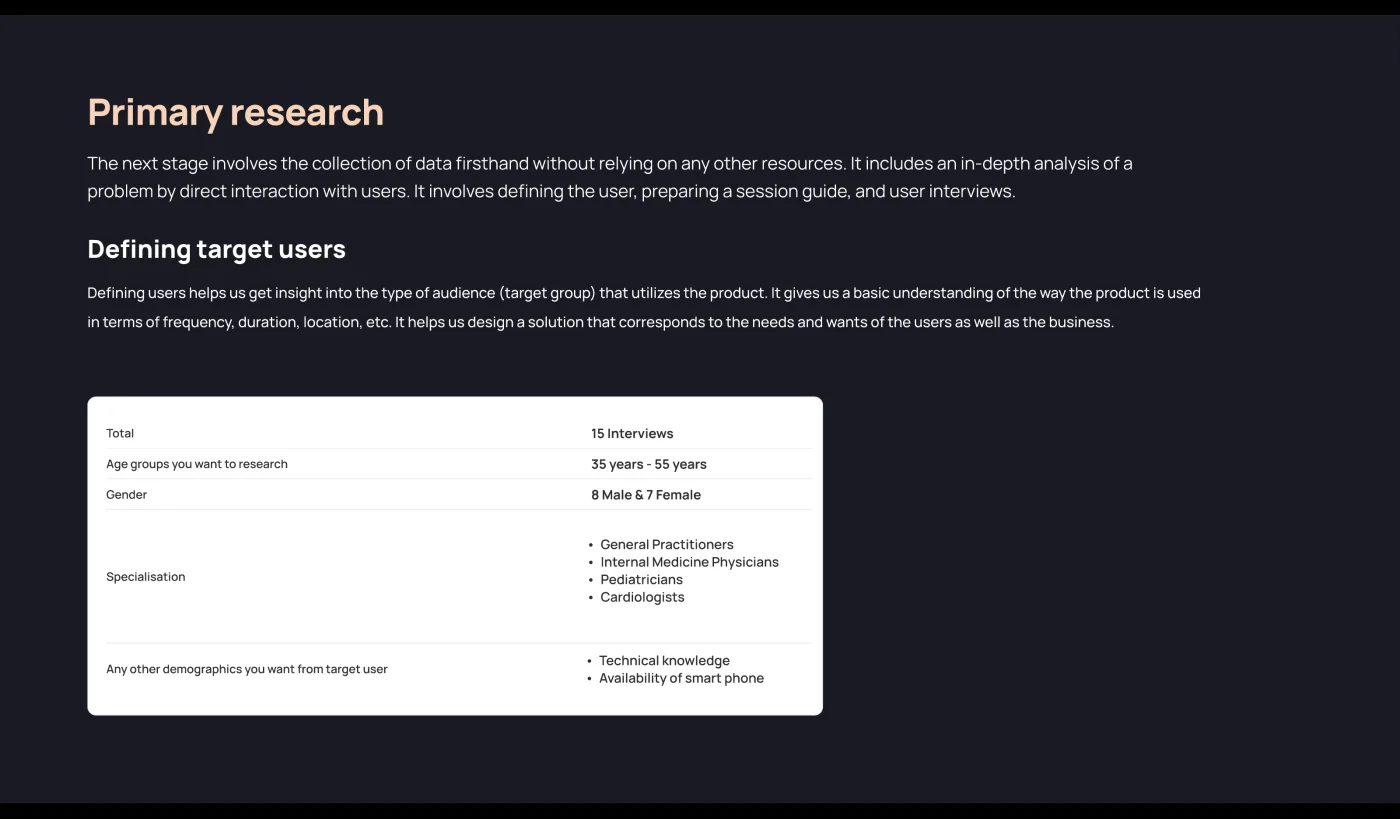
Defining the target user first, so the sample would represent the practice we were designing for rather than the doctors who were easiest to reach.
| Total | 15 interviewees |
| Age group | 35–55 years |
| Gender | 8 male, 7 female |
| Specialisation | General practitioners · Internal medicine physicians · Paediatricians · Cardiologists |
| Screened on | Technical knowledge · availability of a smartphone |
What I asked
How many patients do you see in a day?
How much time do you give each patient?
How do you keep track of whether the treatment is effective?
How do you manage patient appointments?
How long does it take you to write a prescription?
What does a general patient visit look like?
What the data said
The single number that reframed the project: doctors feel 30% of their working time is lost to inefficient documentation. Not to patients — to writing things down.
Effectiveness is tracked by return visit. 46% used follow-up appointments as their primary method of assessing whether a treatment worked — meaning the record has to survive between visits to be worth anything.
Scheduling was already digital; documentation was not. 63% used an integrated digital appointment system, yet more than half still wrote notes by hand. The gap was not resistance to software in general. It was resistance to software during the consultation.
A prescription took 2–3 minutes. That is the number the product had to beat.
The shape of a visit
| Check-in | 5 minutes |
| Consultation | 15 minutes — history-taking, physical exam, care planning |
| Documentation | 10 minutes — during or after the visit |
Ten minutes of documentation against fifteen of care. On a 35-patient day that is nearly six hours of typing.
What I saw in clinics
Interviews gave me the numbers. Sitting in ten clinics gave me the constraint that shaped every screen after it.
From the beta group
- Different needs. Every speciality has requirements beyond the regular treatment flow.
- Guidelines and compliance. Without meeting them, practice is not possible — so compliance could not be a later phase.
- Time constraint. Consultations were already taking too long to complete.
- Capturing relevant data is crucial. With limited time, recording it manually per patient was very difficult.
From observation
- 5 to 20 minutes per consultation, case by case — not a fixed slot.
- 70% of patients presented with similar symptoms. The same few patterns, typed out fresh every time.
- Resistance to change. Many doctors feared a digital system would complicate their workflow rather than simplify it.
- Most doctors had no computer, laptop or tablet.
Two of those findings together are the whole product. If 70% of patients present alike, the typing is repetitive — and repetition is compressible. If most doctors have no computer, it has to compress on the device already in their pocket.
The core problem
“Manual record-keeping and time-consuming documentation make it difficult to efficiently manage patient history, prescriptions, and follow-ups, leading to frustration and reduced consultation time.”
Three takeaways from the interviews sharpened it further:
- Loss of treatment records. Doctors were struggling to record data during the consultation, so it was reconstructed afterwards or lost.
- Need for accessibility. Many doctors preferred a digital system for patient interactions — the appetite existed.
- Time-consuming administrative tasks. Overly burdensome, especially for doctors seeing 50+ patients a day, and directly detracting from patient care.
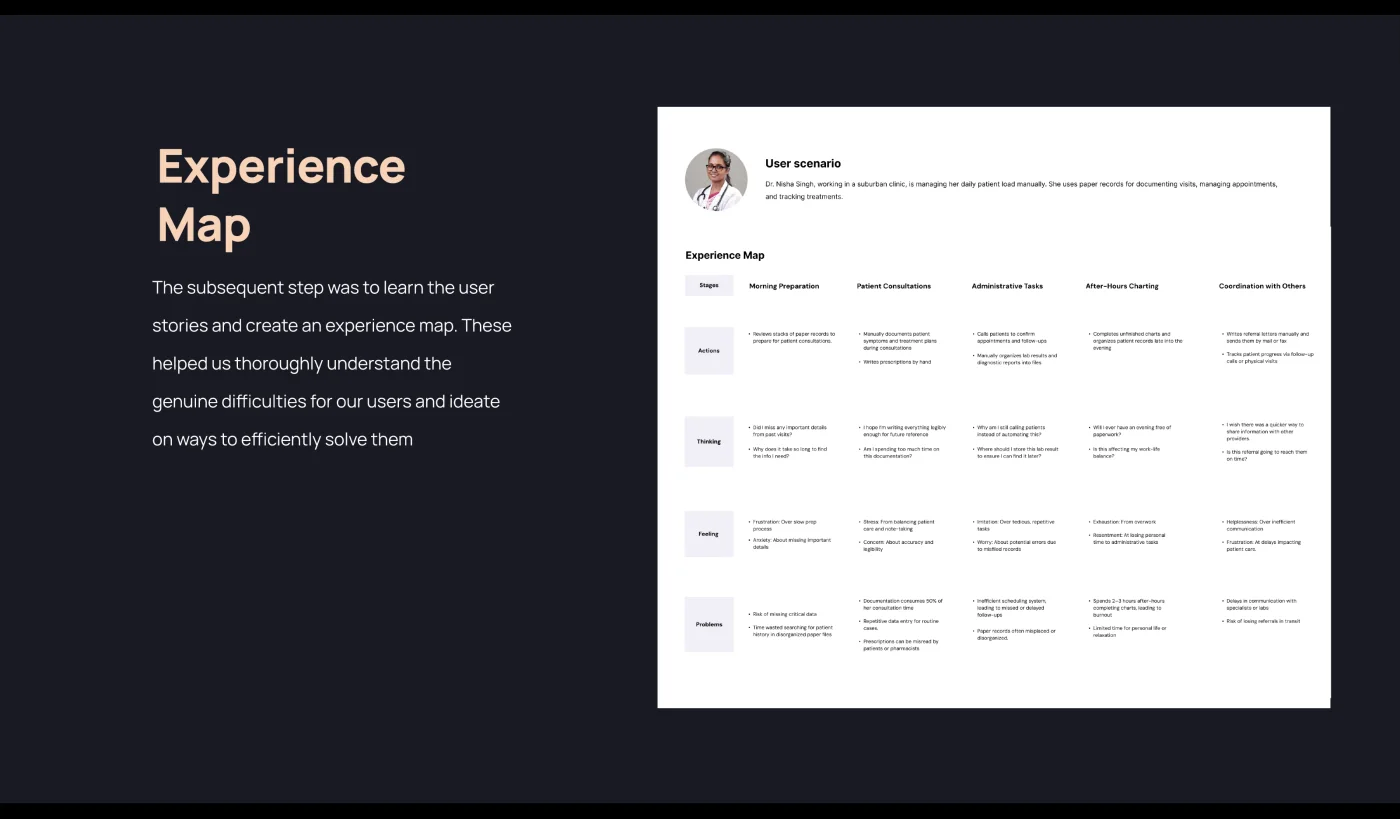
Ideation
Pen and paper first — the fastest way to put early ideas on the table and kill the ones that were not addressing the problem.
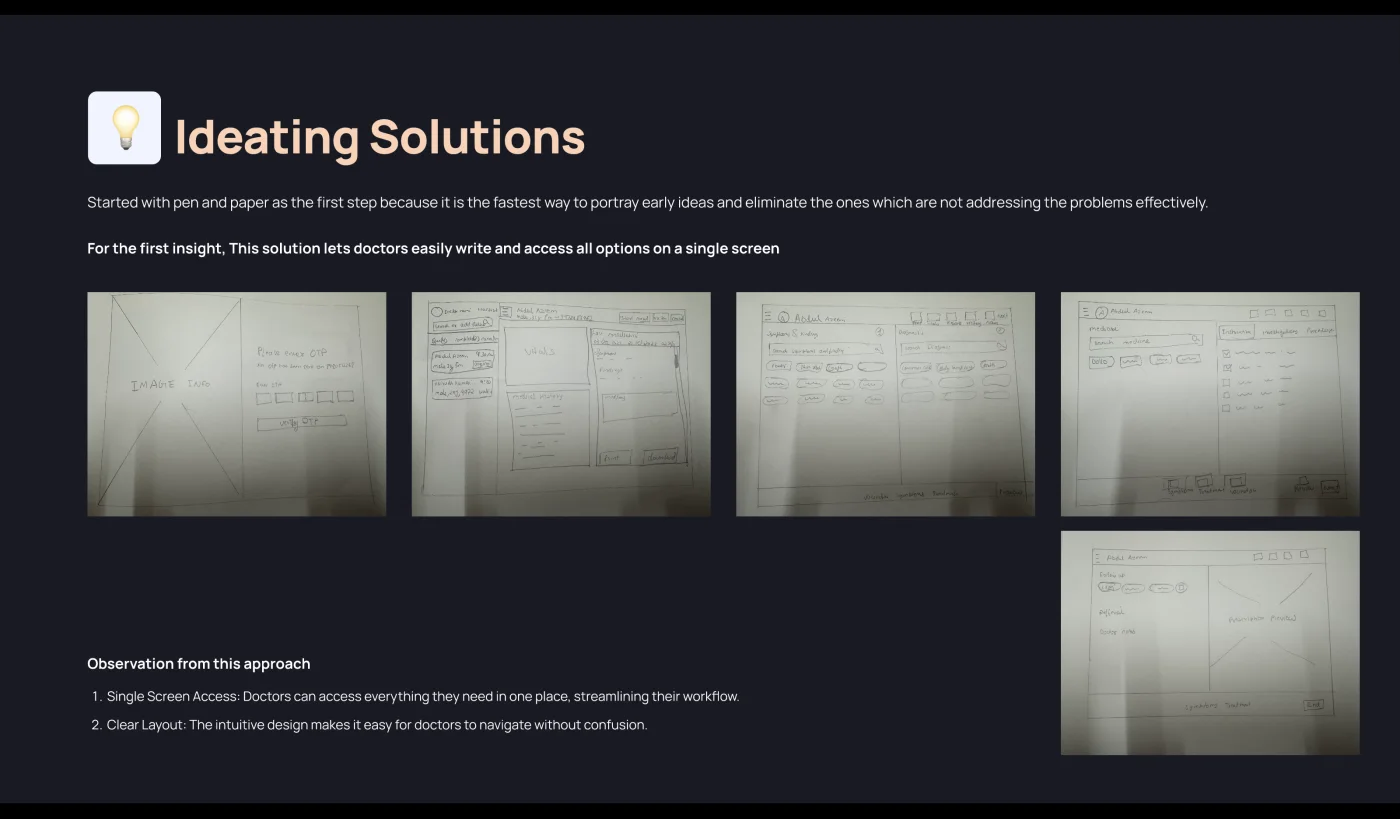
What the sketching settled
- Single-screen access. Doctors can reach everything they need in one place, without leaving the consultation to go find it.
- Clear layout. The structure had to be navigable without instruction — for an audience that was already sceptical that software would help.
The consultation flow
I mapped detailed user flows with the product manager. The diagrams produced the insight that set the information architecture.
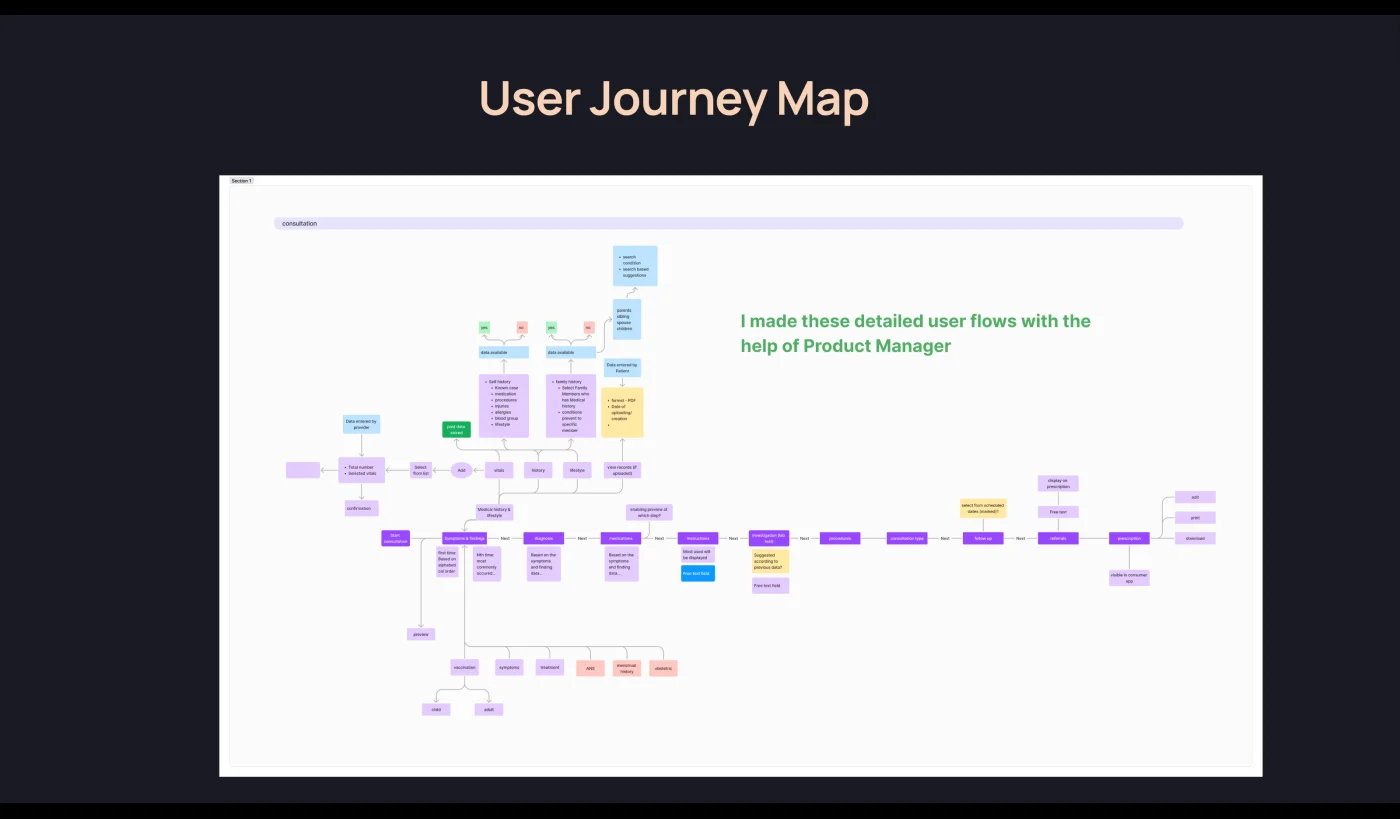
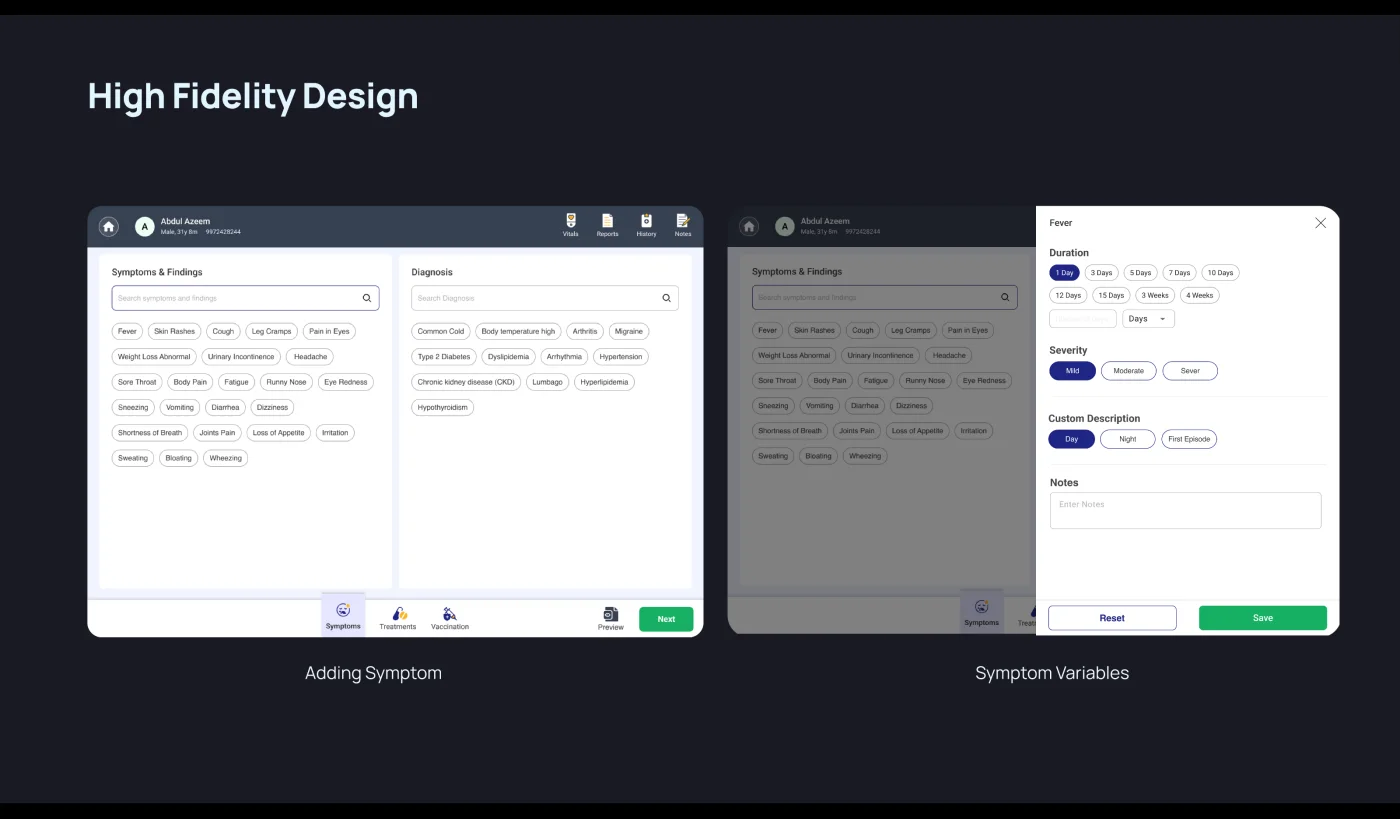
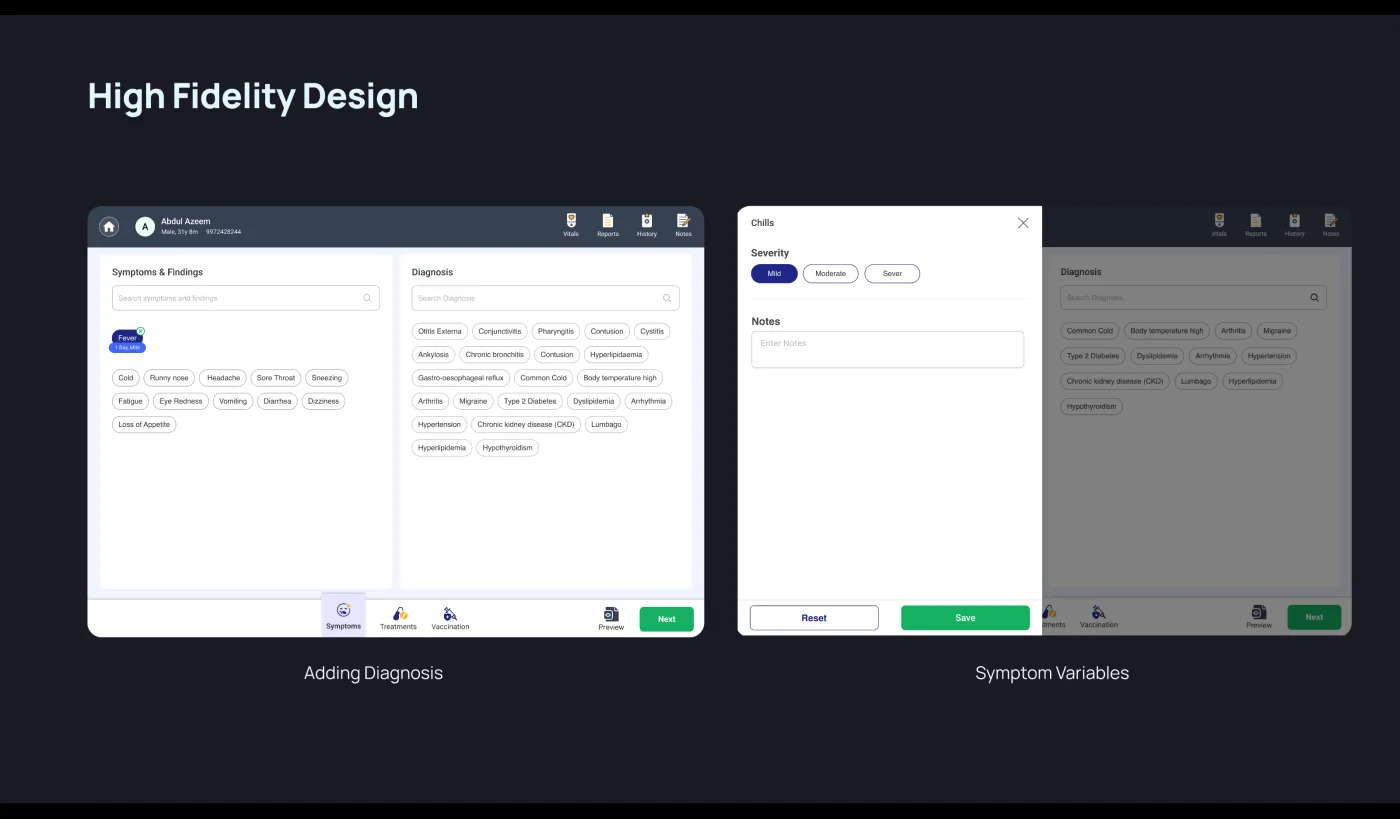
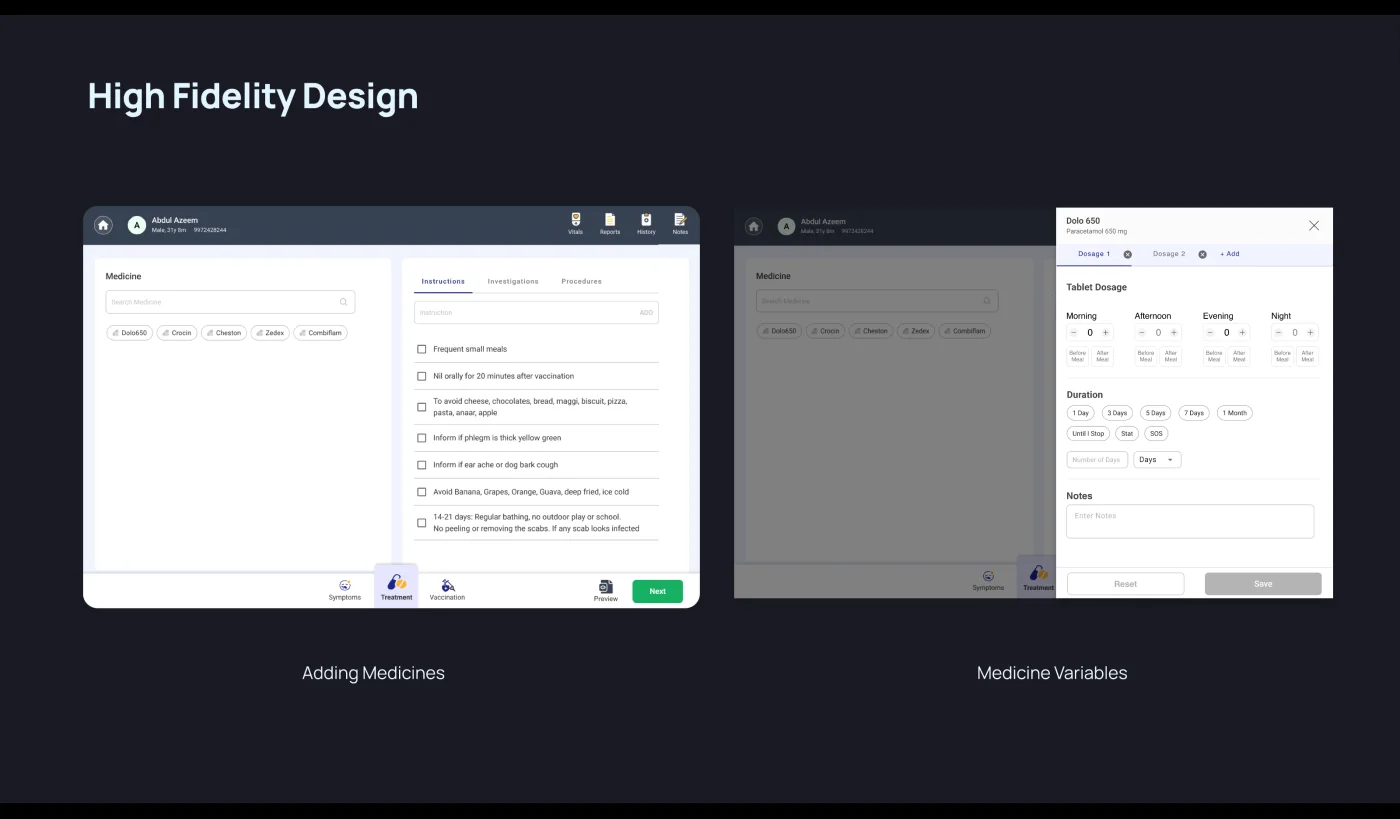
The consultation order was consistent across every doctor we studied. Whatever the speciality, the sequence held: symptoms, then diagnosis, then medicine.
That let the interface commit to one spine instead of trying to be neutral. Three steps, always in the same order, each one a place the record gets written as a by-product of the work rather than after it.
The detail is where prescriptions go wrong. Duration of symptoms and specific dosages carry the clinical meaning — and doctors were recording them in 6+ different prescription formats.
Standardising the capture without flattening the clinical nuance became the central design problem: structured enough to be data, flexible enough to be medicine.
From wireframes to the interface
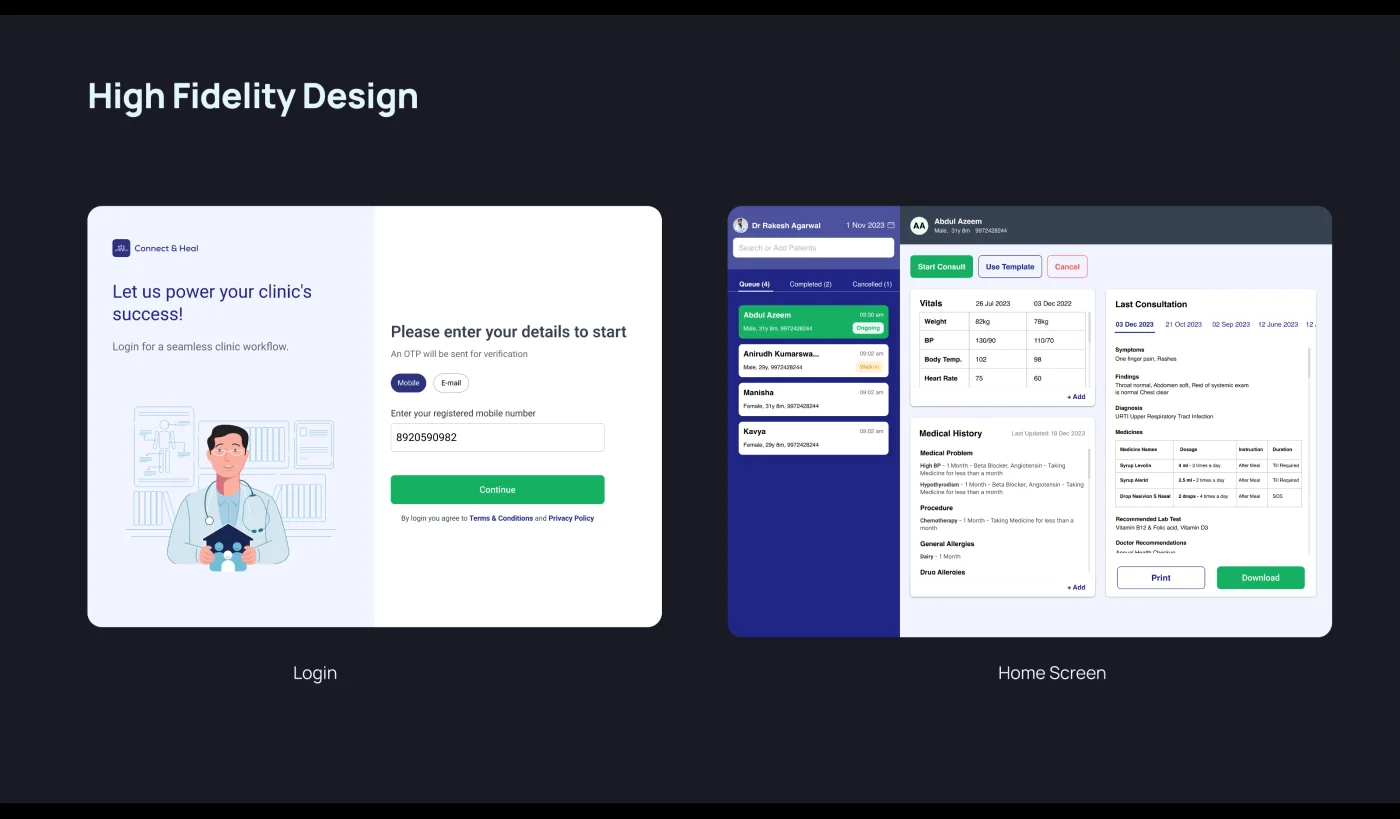
Login and onboarding, then the consultation spine: symptoms → diagnosis → medicines, each with a variables panel for the detail that makes a prescription clinically precise.
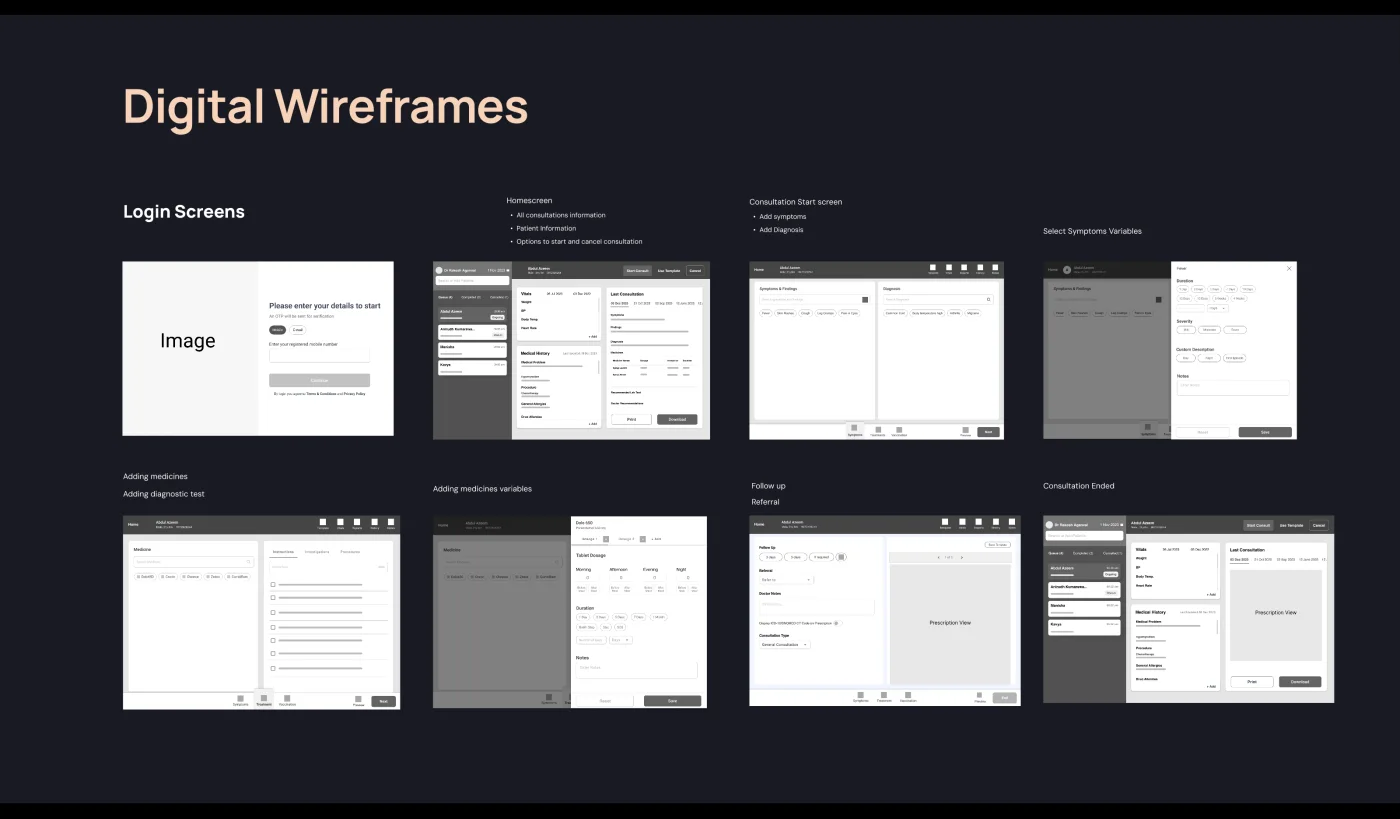
The shipped interface
Usability testing
An unmoderated, task-based study of the prescription journey, run 3–14 March 2026 with the CNH digital transformation group.
What testing produced
Save and reuse prescription templates. Doctors create a template for a common condition and apply it to the next patient who presents the same way — select, review, prescribe, in one action.
This is the feature the research had been pointing at the whole time. If 70% of patients present with similar symptoms, the highest-value thing the software can do is refuse to make the doctor type the same thing twice.
Outcome and what I learned
A 65% improvement in workflow efficiency overall, and template usage up 200% — the reuse mechanism became the way the product was used, not a power-user feature.
What I would carry to the next one
- Human-centred design. Insights from a deliberately varied group of doctors produced a more usable product than designing for the average would have.
- Early engineering involvement. Bringing engineering in at the start prevented technical issues and made development smoother.
- A strong foundation. Focusing the first phase on core functionality saved time and resources in every stage after it.
- Design systems. A shared system kept consistency and efficiency across teams as the surface area grew.
- Leadership support. Won by demonstrating potential ROI, which is what made early buy-in possible.